Are you looking for some good Dune Analytics STEPN dashboards?
Maybe you’re curious to see how STEPN’s economy is evolving and have to the realization that Dune Analytics might be a good way to find out?
Well, you’re absolutely right, because there are many very detailed and insightful Dune STEPN dashboards available out there.
In this guide, we’ll show you some of the best Dune Analytics STEPN dashboards that you should add to your bookmarks.
Key Points (tl;dr)
- Dune Analytics is a very popular tool amongst blockchain analysts. It allows you to easily extract data from various blockchains using simple SQL queries and create meaningful charts.
- Dune pulls its data from dedicated nodes that it runs in cooperation with major node operators and currently supports data for Ethereum, Polygon, Binance Smart Chain, Gnosis Chain, and Solana.
- Our top 6 Dune Analytics STEPN dashboards are:
- STEPN Core Metrics by @nguyentoan
- STEPN Show Analytics & Dashboard by @0xArt
- STEPN on Solana by @yehjames
- STEPN Analytics for BSC by @gankthisway
- STEPN Game Metrics by @0xbesthand
- STEPN Overview Dashboard by @Howard_Peng
For a full list of the best Dune STEPN Analytics dashboards, PLEASE SCROLL FURTHER DOWN THE ARTICLE.
Like this content? Then share it!
The 6 Best Dune Analytics STEPN Dashboards
www.tokenizedhq.com
Here’s the answer. Great article by @ChrisHeidorn right here: https://tokenizedhq.com/dune-analytics-stepn/
What is Dune Analytics?
Dune Analytics is a free-to-use analytics platform that enables users to easily extract historical blockchain data and transform it into human-readable tables and charts.
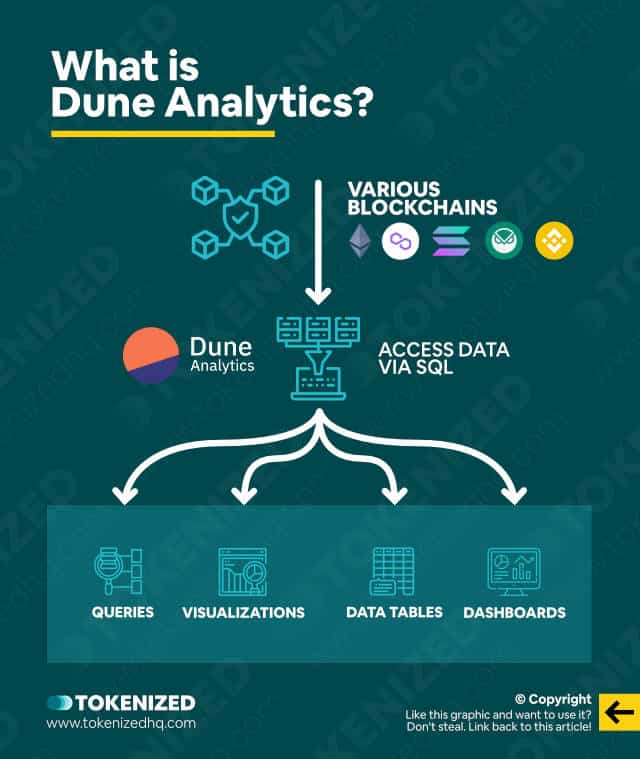
Anyone who’s spent a little more time trying to find data in order to analyze different blockchain projects has usually stumbled upon Dune Analytics at some point.
Most of the time it just happens by coincidence because someone else previously create a dashboard and shared it with others.
What makes Dune Analytics so special is that it gives people a very user-friendly way of pulling together and visualizing data.
Anyone who is familiar with basic SQL queries and easily puts together some really powerful charts.
Once we show you some of the Dune STEPN dashboards, you’ll really begin to understand what we mean.
We also have a really nice list of Dune Analytics OpenSea dashboards, if you’re keen to see how the NFT market is doing overall.
It’s a tool that is particularly popular amongst analysts who don’t necessarily want to spend tons of money on paid software.
Dune Analytics does some with a “Pro” plan, however, it’s mainly tailored towards people who want to keep their analysis private and need power-user features.
How Does Dune Analytics Get its Data?
Dune Analytics currently partners with node providers in order to optimize their procurement of blockchain data. Supported blockchains include Ethereum, Polygon, Optimism, Gnosis Chain, Binance Smart Chain, and Solana.
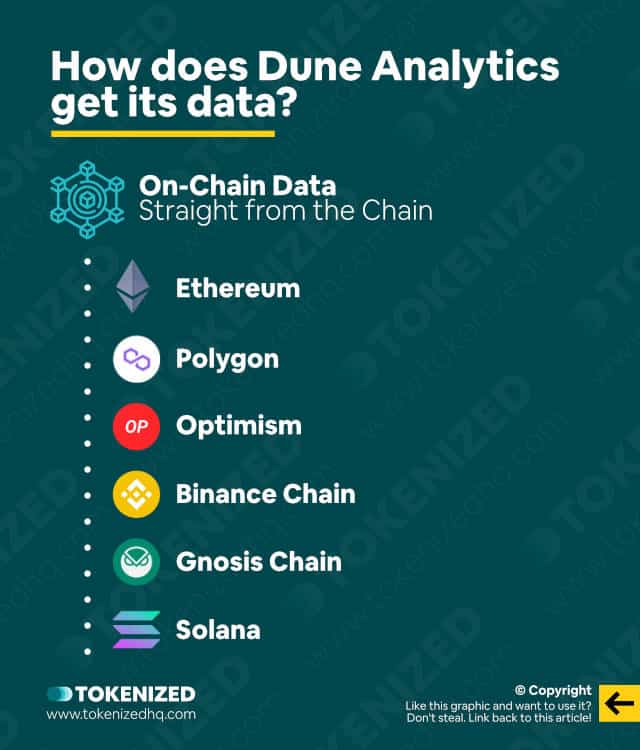
Dune Analytics gathers all of its database running dedicated nodes for various different blockchains.
Technically they could also use a 3rd-party service, however, given their massive requirements it’s safe to assume that Dune Analytics is cooperating with node providers in some way.
It will also interest you to hear that they are currently working on a public Dune Analytics API, but details are still unknown.
Either way, the supported blockchains include Ethereum, Polygon, Gnosis Chain, Optimism, Binance Smart Chain, and Solana.
The 2 blockchains in this list that are critical for us right now are Binance Smart Chain and Solana.
STEPN Realms 1 and 2 run on top of these two blockchains and therefore it’s fairly easy for us to pull data from Dune Analytics for STEPN.
6 Dune Analytics STEPN Dashboards You Should Know
- STEPN Core Metrics by @nguyentoan
- STEPN Show Analytics & Dashboard by @0xArt
- STEPN on Solana by @yehjames
- STEPN Analytics for BSC by @gankthisway
- STEPN Game Metrics by @0xbesthand
- STEPN Overview Dashboard by @Howard_Peng
Although the number of Dune Analytics STEPN dashboards was still relatively small only a few months ago, STEPN’s massive success in early 2022 changed that dramatically.
Now there are dozens of different Dune STEPN dashboards built by people from all over the world.
Most of them are in English, but there are others in Chine and Korean as well.
It just goes to show how global the Move-to-Earn space is and how many people are keen to give STEPN a try.
We had a closer look at some of the most popular Dune STEPN dashboards and have tried to separate the wheat from the chaff for you.
Here’s our list of the 6 best Dune Analytics dashboards that everyone should know right now.
1. STEPN Core Metrics
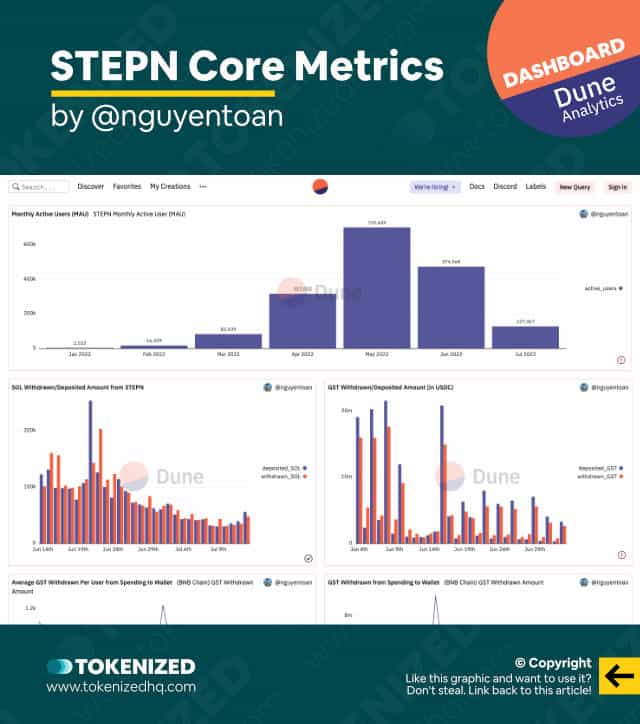
The first Dune Analytics STEPN dashboard on our list was created by @nguyentoan.
Nguyen Toan isn’t just an analyst, he’s also an avid STEPN user and his dashboard attempts to capture where STEPN is heading as well as whether it is sustainable or not.
He tries to provide as many unbiased views as possible and just wants to give people the power to the right decisions for themselves.
Queries and visualizations in this dashboard:
- Monthly Active Users
- Token Withdrawals/Deposits (SOL & GST)
- Token Prices (SOL, GST, GMT)
- New & Returning Active Users
- User Engagement
- Top 100 Wallets
- Transaction Analysis
Check it out here: STEPN Core Metrics
2. STEPN Shoe Analytics & Dashboard
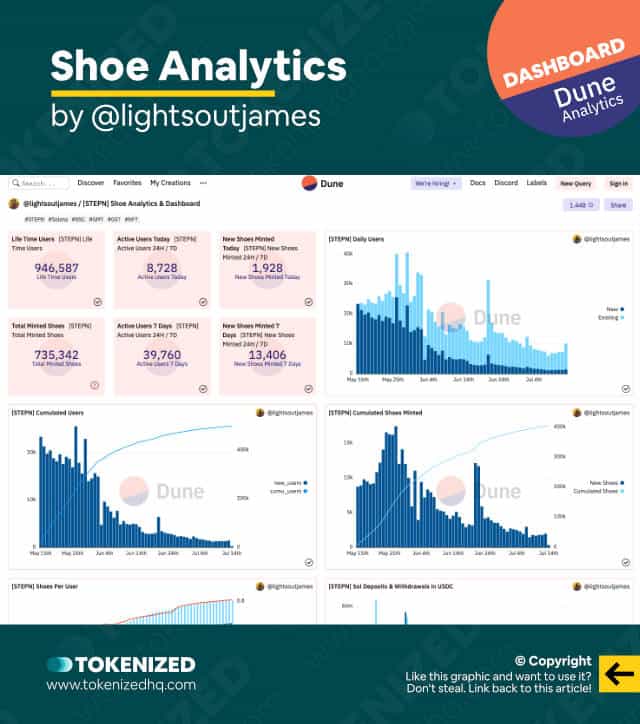
The next Dune Analytics STEPN dashboard was created by @lightsoutjames.
While not as extensive as the previous one, this dashboard excels in terms of clarity.
It focuses on a number of key metrics and it is particularly good at harnessing them in meaningful and actionable visualizations.
Queries and visualizations in this dashboard:
- Headline User & Shoe Metrics
- Cumulative & Active Users
- Shoe-Minting Statistics
- Deposits & Withdrawals
- Transactions
Check it out here: STEPN Shoe Analytics & Dashboard
3. STEPN on Solana
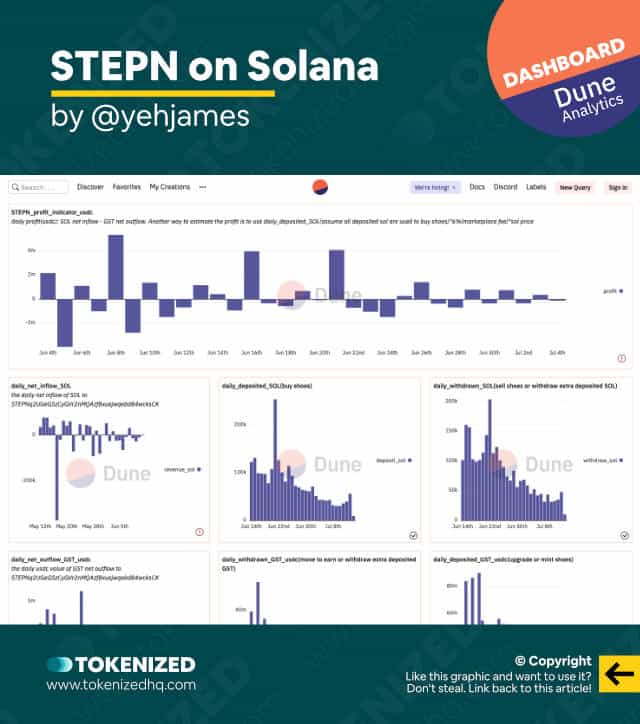
This is a somewhat simple Dune STEPN dashboard by @yehjames.
It’s not as clean or detailed as the other two dashboards we listed earlier.
However, it provides some very different and valuable perspectives on the available STEPN data.
We particularly like the STEPN profit indicator that tries to extrapolate how much profit (or loss) STEPN is making via its marketplace transactions.
In other words, it helps determine how well STEPN’s business model is doing.
Queries and visualizations in this dashboard:
- STEPN Profit Indicator
- Net Inflows & Outflows
Check it out here: STEPN on Solana
4. STEPN Analysis for BSC
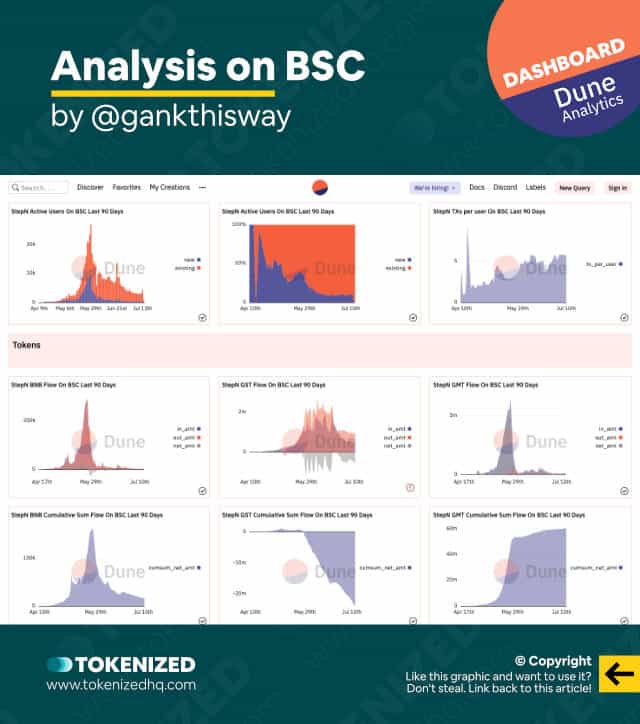
This BSC-centric Dune STEPN dashboard was created by @gankthisway.
Gankthisway is a blockchain data analyst and has chosen to only focus on the BNB Realm.
What we particularly like about this dashboard are the charts on BNB token flows as well as the “shoe flows”.
An interesting detail is that newly minted Sneakers do not actually show up in the on-chain data and are only reflected once they are transferred out.
In other words, Dune Analytics can only reflect what is happening on the main blockchains, but not the activity within the in-game sidechains.
Queries and visualizations in this dashboard:
- Various User-related Metrics
- Various Charts for Token Flows
- Various Shoe-Minting Charts
- STEPN Profit Analysis
Check it out here: STEPN Analysis for BSC
5. STEPN Game Metrics
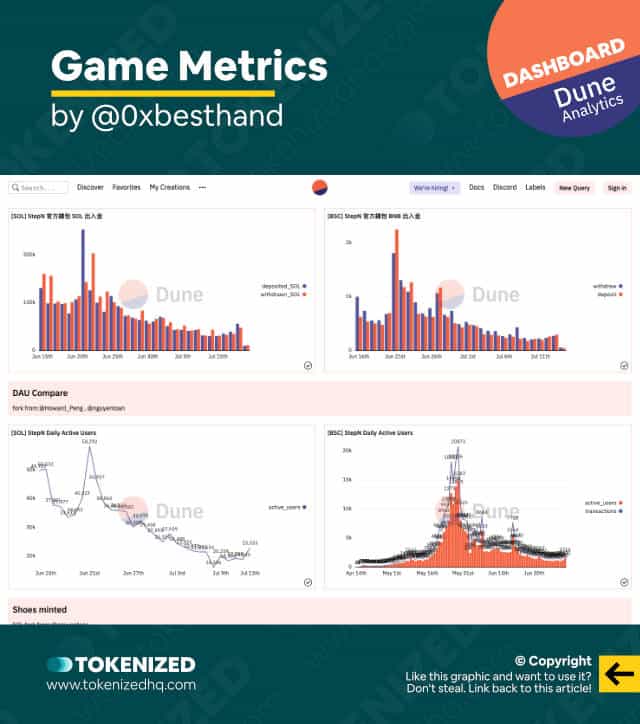
This Dune STEPN dashboard was built by @0xbesthand and originally forked from @Howard_Peng‘s and @nguyentoan‘s work.
It’s a much simpler dashboard and effectively only looks at deposits and withdrawals, active users, and minted shoes.
However, it allows you to compare the Solana and BNB Realms quite well.
Queries and visualizations in this dashboard:
- Deposits & Withdrawals for SOL & BNB
- Daily Active Users for SOL & BNB
- Shoe-Minting for SOL & BNB
Check it out here: STEPN Game Metrics
6. STEPN Overview Dashboard
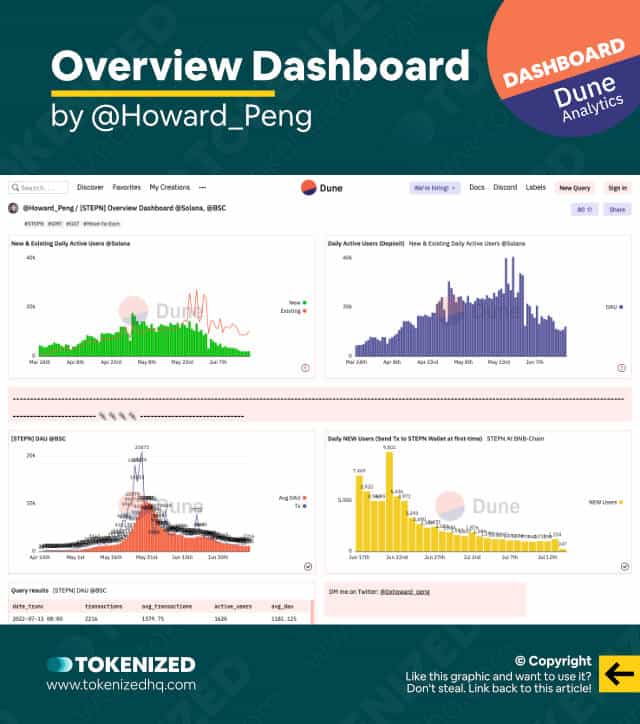
Our final Dune Analytics STEPN dashboard was created by @Howard_Peng.
Howard used to be a Data Analyst at Binance but has since moved on to new projects.
It’s a simple but straightforward dashboard that focuses on daily active user trends on Solana and Binance Chain.
And let’s face it, that’s effectively the core metric that really matters.
Check it out here: STEPN Overview Dashboard
Conclusion
There’s been a lot of frustration amongst many STEPN users who simply weren’t prepared for what would happen in a crypto bear market.
These dashboards with on-chain data help remove some of the noise and provide clarity on what is actually happening in the background.
Data doesn’t lie and you can clearly see that activity is returning to STEPN right now.
Here at Tokenized, we want to help you learn as much as possible about the coming NFT revolution. We help you navigate this fascinating new world of non-fungible tokens and show you how you can integrate tokenization into your own business.


